This section provides some enterprise-specific information about several of Toast's reports.
Enterprise environments have an additional menu report called the Reports > Menus > Product mix compare report, shown below.
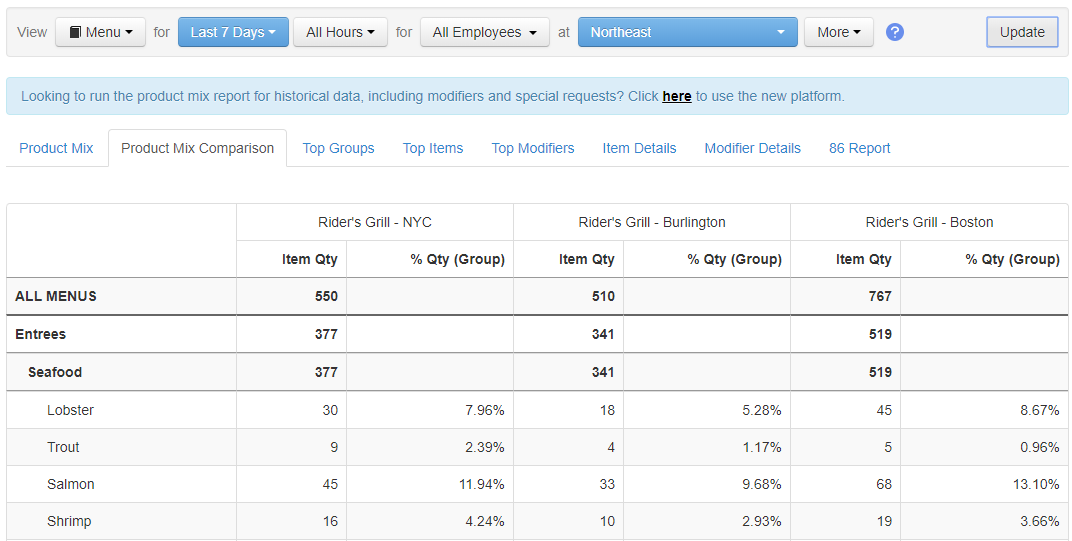
This report allows you to compare how your menu items are selling at various locations. It has columns for each of the locations you have selected to view. Within these location-specific columns, you see the Item Qty and % Qty (Group) columns. The Item Qty column displays the number of times an item has been ordered during the specified time period. The % Qty (Group) column displays the percentage that each menu item contributes to the overall number of menu items ordered from the parent menu group. For example, in the illustration above, the Lobster menu item has been ordered 30 times while the total number of items ordered from the Seafood menu group is 377, making the Lobster menu item 7.96% of the total number of Seafood items ordered (30/377 x 100 = 7.96%).
You are limited to viewing one location at a time on the Reports > Cash and loss management > Drawer history report and on the Reports > Payments > Daily credit card activity report. However, you are not limited to viewing these reports for the session restaurant only. You can choose to view these reports for any location you have permissions to from the restaurant hierarchy drop-down menu.
The Reports > Employee performance > Employee productivity report has one row for each employee/location combination. So, if an employee works at multiple locations, the tab will include multiple rows for that employee, one for each location.